Electrification Ascendant: The Global Race for EV Dominance in a Mineral-Constrained World - Part I
Executive Summary
The electric vehicle revolution has transcended early-adoption narrative to become a structural transformation reshaping the global automotive and energy landscape. In 2024, electric vehicles captured over 20 percent of global new car sales for the first time, with projections accelerating toward 50 percent penetration by 2030 and 70 percent by 2040.
China has emerged as the dominant force, commanding 57 percent of global battery-electric vehicle sales while exerting hegemonic control over the critical processing of battery minerals. This position yields profound geopolitical advantages. Simultaneously, a structural constraint now defines the competitive terrain: the extraction and refinement of lithium, cobalt, nickel, and silver required to power mass electrification cannot meet projected demand under current supply frameworks.
Geographic concentration of mineral production and overwhelming Chinese dominance in processing create bottlenecks that threaten the viability of net-zero targets by mid-century.
The United States and the European Union have responded with aggressive protectionist policies and supply-chain localization mandates. At the same time, emerging economies like India and Indonesia face the dual burden of infrastructure scarcity and environmental degradation. Battery technology innovation and recycling solutions offer palliatives but cannot resolve near-term deficits.
The next five years will determine whether the energy transition succeeds as an orchestrated global effort or fractures into competing regional supply chains, each bearing different costs and constraints.
Historical Context and Market Evolution
The contemporary EV market bears little resemblance to the niche segment of a decade ago.
Global EV sales in 2015 represented approximately 1.2 million units; by 2024, this figure had expanded to 17 million units annually, representing an exponential trajectory. This acceleration has been driven by three converging forces: technological maturation of battery chemistry, aggressive government policy interventions including subsidies and regulatory mandates, and declining manufacturing costs that have narrowed the price differential between electric and internal combustion engine vehicles.
Norway established the template for rapid adoption, reaching 88 percent battery electric vehicle penetration by 2024 through sustained fiscal incentives and charging infrastructure development.
Concurrently, China’s government directed state resources toward vertical integration of the EV supply chain, positioning domestic manufacturers not merely as assemblers but as technological innovators commanding intellectual property advantages.
Tesla’s entry into the market in 2010 and subsequent dominance through 2020 created the perception of American technological leadership; this narrative has been substantially inverted.
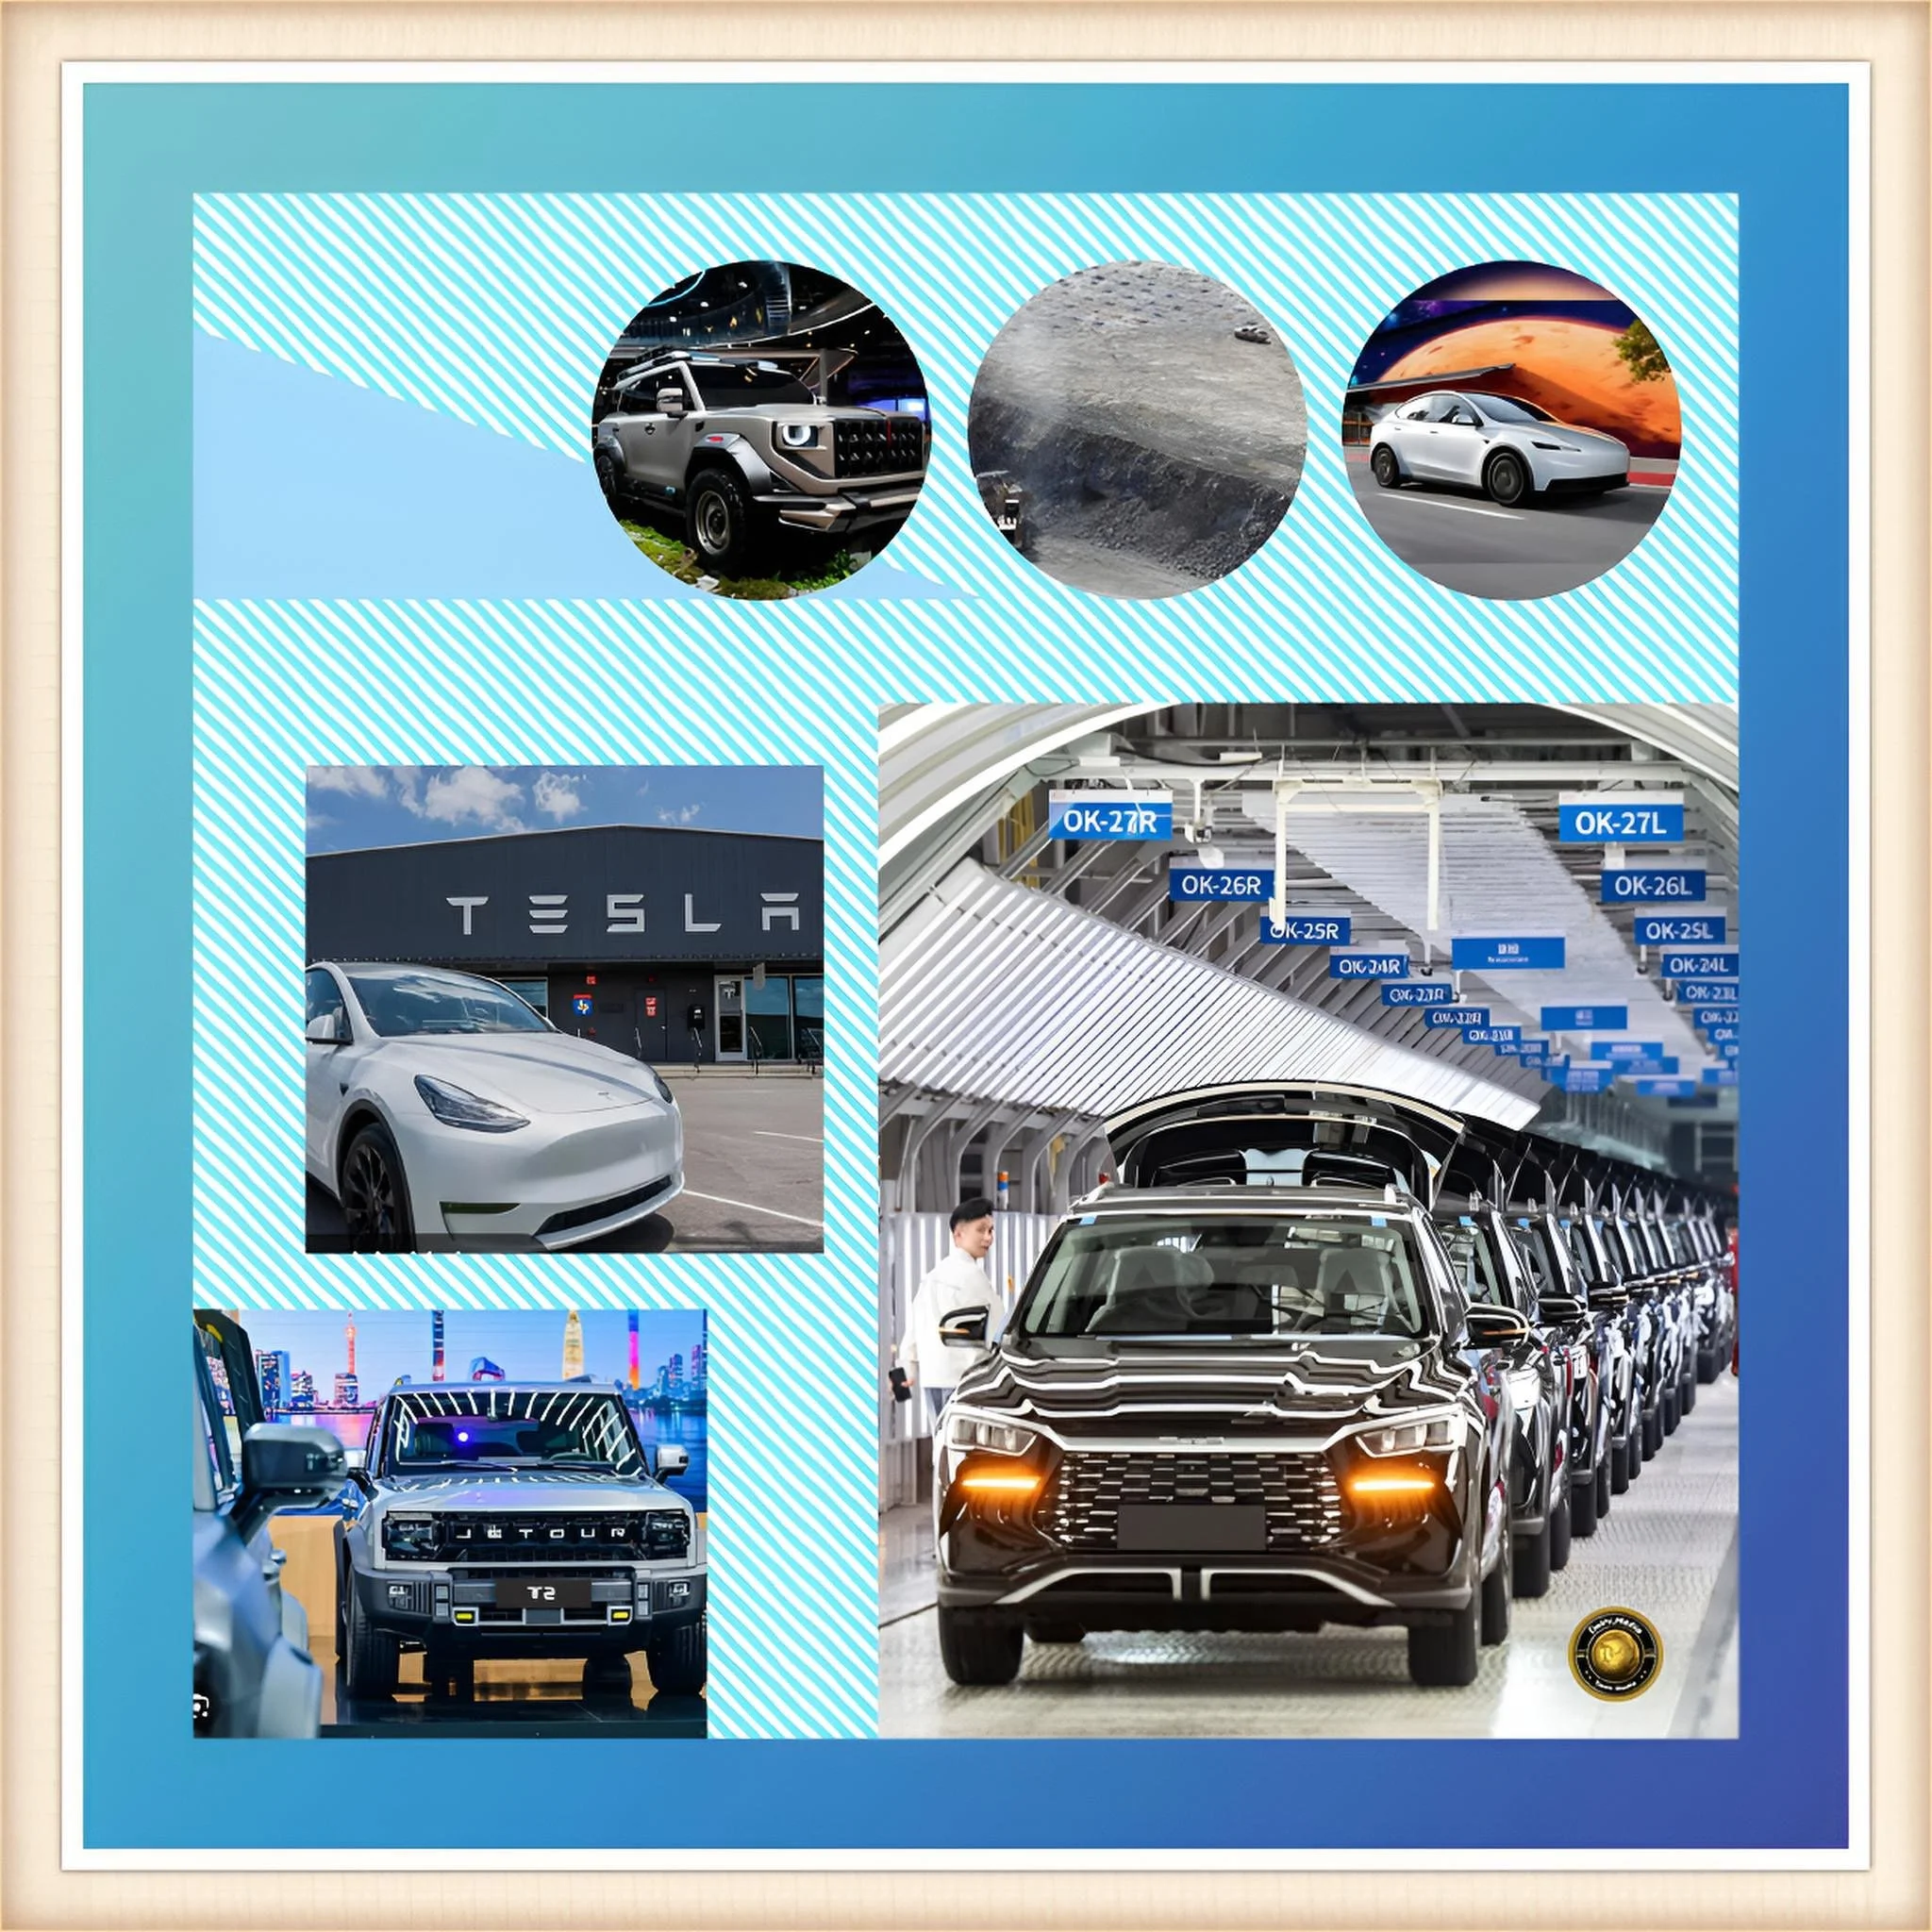
By 2024, Chinese manufacturer BYD surpassed Tesla in global battery-electric vehicle sales for the first time, delivering 4.27 million vehicles to capture 34.1 percent of the Chinese market and establishing export networks across multiple continents.
This transition represents not a cyclical market dynamic but a structural reordering reflecting manufacturing scale, supply chain integration, and cost competitiveness.
The historical pattern of automotive industry disruption parallels the EV transition. The rise of Japanese automakers in the 1970s and 1980s provoked initial Western skepticism, then defensive protectionism, before culminating in market capitulation.
Evidence suggests that Chinese EV manufacturers are following an analogous trajectory, but at an accelerated pace and with stronger state support.
Chinese EV exports reached 1.25 million vehicles in 2024, a figure that would have appeared implausible five years prior. This export penetration, combined with Chinese dominance in battery technology and mineral processing, has alarmed Western policymakers sufficiently to trigger tariff escalation and domestic industrial policy interventions unprecedented since the post-war period.
Current Status of Global EV Markets and Competitive Positioning
As of the fourth quarter of 2025, the global EV market exhibits sharp geographic divergence reflecting policy frameworks, infrastructure maturity, and income distribution.
China maintains categorical leadership, with new energy vehicle sales reaching 50 percent of total vehicle sales in 2025—the first year internal combustion engines no longer comprised the majority of new sales.
This milestone occurred five years earlier than most prognostications suggested and reflects the combined effects of battery cost reductions, government subsidies averaging 3,000-5,000 USD per vehicle, and a shift in consumer perceptions driven by technological parity with Western competitors.
Chinese automakers collectively dominate the global zero-emission vehicle rankings, occupying the top five positions. BYD and Tesla continue their competition for market leadership, with BYD demonstrating stronger year-over-year growth through expanded product lines spanning from budget city vehicles like the Seagull, priced below 5,000 USD, to luxury offerings under the Yangwang brand. Li Auto and other domestic manufacturers have captured market share by offering vehicles targeted at family transportation needs, incorporating autonomous-driving features and extended-range capabilities unavailable from international competitors at comparable price points.
European markets represent the second tier of adoption, with combined EU and UK markets capturing approximately 23 percent new-energy vehicle penetration as of mid-2025. Germany leads absolute sales volume with 570,400 units, though market share remains modest at 26 percent due to market size considerations.
The United Kingdom achieved a 19 percent market share, while France and the Netherlands demonstrated strong infrastructure development supporting continued adoption. However, European growth has decelerated from previous trajectories, constrained by subsidy reductions and increased competition from Chinese imports, particularly at the mid-market price point traditionally dominated by European manufacturers.
Regulatory pressure remains intense, with the European Union’s “Fit for 55” package mandating 55 percent greenhouse gas emission reductions by 2030 and prohibiting new internal combustion engine vehicle sales from 2035, creating regulatory certainty for EV investment but also competitive urgency as legacy automakers reallocate capital from profitable traditional vehicle production.
The United States market represents the most complex competitive environment. Total EV sales reached 1.5 million units in 2024, representing approximately 4.5 percent of new vehicle sales and remaining significantly below projections made in 2020. More concerning, electrified vehicle sales growth has plateaued, declining from approximately 10 percent market share in early 2025 to roughly 9 percent by mid-year, with growth concentrated in plug-in hybrid electric vehicles rather than battery electric vehicles.
This deceleration reflects multiple constraints: policy uncertainty regarding the Inflation Reduction Act incentives, tariff escalation on Chinese imports, and regional variation in charging infrastructure development.
California alone accounts for approximately 50 percent of all US EV sales, a concentration that demonstrates the critical role of state-level policy in the absence of a cohesive federal framework. American automakers have responded by reallocating capital toward EV production, though several announced battery plants have been delayed or cancelled amid tariff uncertainty and weakening demand growth.
Tesla’s US market dominance has been challenged by legacy automakers expanding EV lineups, though Tesla maintains quality and autonomous driving feature advantages that sustain premium pricing and customer loyalty.
Emerging markets present both enormous opportunities and structural constraints. India has set an ambitious target of 30 percent EV market share by 2030. Yet, current penetration stands at 2.5 percent of new vehicle sales, with growth rates that need to accelerate from 200 basis points annually to 380 basis points annually to achieve the target.
India’s EV market is dominated by two- and three-wheelers, which account for the majority of electrified vehicles sold. Passenger EV adoption is hindered by charging infrastructure deficits (only 25,000 public charging stations for a population of 1.4 billion), high price premiums relative to internal combustion alternatives, and policy inconsistency, as subsidy schemes have excluded passenger vehicles despite passenger EVs being central to the 2030 target.
Indonesia, while not a direct consumer market for EVs, has become a critical part of global supply chains through nickel mining and processing. The country aims to capture 80 percent of global nickel production by 2040, positioning itself as a strategic supplier while simultaneously experiencing environmental catastrophe.
Southeast Asia more broadly demonstrates rapid EV adoption, with Thailand achieving 13 percent EV market share in 2024 and sales in Indonesia tripling, though from a minimal base.
Latin America experienced explosive growth in specific markets, with Brazil doubling EV sales to 125,000 units (6.2 percent share) and Colombia and Costa Rica achieving 15 percent penetration through a combination of government incentives and targeted policy toward electric public transportation.
South Korea presents a controlled laboratory for competitive dynamics. The country recorded 201,000 EV registrations in 2024, surpassing 200,000 units annually for the first time. Domestic manufacturers Hyundai and Kia collectively command approximately 55-60 percent market share through expanded product lines and technological advancement, yet face intensifying pressure from European premium brands targeting the high-end segment and Chinese manufacturers, including BYD, Zeekr, and Xpeng, targeting mid-market and budget segments.
This competitive “sandwich” dynamic presages the global market structure likely to emerge through 2030, in which Western manufacturers control premium segments, Chinese competitors dominate volume and value segments, and emerging opportunities in autonomous vehicle and energy storage technologies will determine long-term competitive positioning.
Critical Mineral Supply Chain: Structural Constraints and Geopolitical Implications
The foundation of EV proliferation rests on battery chemistry, and battery chemistry rests on access to critical minerals distributed globally, with acute geographic concentration.
This concentration creates asymmetric dependencies that have transformed mineral markets from commodity exchanges into strategic assets comparable to energy resources.
Lithium, essential to virtually all current EV battery chemistries, illustrates the constraint structure. Global lithium demand has accelerated from 100,000 tonnes of lithium carbonate equivalent in 2015 to approximately 1.15 million tonnes in 2024, with projections reaching 3 million tonnes by 2030.
Mining capacity utilization approaches 100 percent, indicating zero slack in the supply chain. The International Energy Agency estimates that by 2029, even if all announced mining projects reach commercial production as scheduled, lithium supply will cover only 85 percent of projected demand.
By 2035, the supply-demand deficit widens to 30 percent. These projections assume optimistic timelines for mine development and permitting—assumptions contradicted by historical experience. New lithium mining projects require 10-17 years from exploration to commercial production. Serbia’s Jadar lithium project, initially approved for development in 2021, faced a two-year delay after public protests revoked mining permits, only to have the decision overturned by the Constitutional Court. Projects cannot be accelerated regardless of financial incentive; they remain constrained by geological and regulatory timelines.
Geographic concentration exacerbates the constraint.
Approximately two-thirds of global lithium production originates from three countries: Chile, Australia, and Argentina, collectively known as the “Lithium Triangle.”
Chile produces approximately 30 percent of the global supply from brine deposits in the Atacama Desert; Australia accounts for roughly 40 percent from hard-rock mining; Argentina contributes approximately 10 percent.
This concentration creates vulnerability to regional disruptions, water stress (more than 50 percent of current lithium production occurs in water-scarce regions), and changes in government policy. In April 2023, Chile’s government implemented restrictions on lithium exports and new mining licenses as part of broader resource nationalism policies, directly constraining global supply. Beyond extraction concentration lies processing concentration, which presents a more severe constraint.
China controls approximately 60 percent of global lithium processing capacity, translating brine and ore concentrates into battery-grade lithium chemicals. This processing control persists despite China producing only 10-15 percent of global lithium ore. Processing capacity represents the actual bottleneck; it requires capital investment, technical expertise, environmental compliance capacity, and proximity to electrochemistry manufacturing. Establishing alternative processing capacity outside China typically takes 3-5 years and involves capital expenditures exceeding 500 million USD per facility. The United States produces less than 3 percent of the world's refined lithium and has no capacity to produce battery-grade lithium from imported ores.
Cobalt supply chains exhibit even greater concentration and include humanitarian dimensions absent from lithium constraints.
The Democratic Republic of Congo produces approximately 70 percent of global cobalt and contains 50 percent of international reserves. Cobalt extraction in the DRC has been documented to involve forced evictions, child labor, and sexual assault by mining company security forces.
Demand for cobalt in EV batteries has surged from 50,000 tonnes in 2015 to a projected 222,000 tonnes by 2025. A typical EV battery pack contains 13 kilograms of cobalt. These supply chains remain opaque; traceability systems capable of verifying ethical sourcing remain nascent, and enforcement of international labor standards proves impossible across DRC mining zones.
Chinese processing capacity also dominates cobalt refining, with China accounting for 70 percent of global refined cobalt despite producing minimal quantities domestically. Geopolitical tension has escalated around cobalt supply, with both US and European policymakers designating cobalt as a critical mineral requiring diversified sourcing.
Nickel supply chains present the third critical mineral constraint. Indonesia dominates global nickel production, accounting for approximately 35 percent of the current supply and positioning itself to capture 80 percent by 2040 through aggressive mining and the development of processing plants. This concentration shift reflects a deliberate government industrial policy that prioritizes nickel production to participate in battery supply chains and attract foreign manufacturing investment. The environmental consequences have been catastrophic. Over 75,000 hectares of Indonesian forest have been cleared for nickel mining and processing since 2010. Deforestation accelerates near processing plants, with forest loss doubling to 63 square kilometers annually around smelters compared to 33 square kilometers in earlier periods. Nickel mining and processing generate massive greenhouse gas emissions from captive coal-fired power plants, undermining climate-mitigation rationales for EV production. Chinese state-owned enterprises and private firms, including Tsingshan, hold substantial interests in Indonesian nickel operations, extending Chinese control over nickel processing and effectively giving China leverage over one of the two primary nickel-producing regions.
Alternatives exist within Russia (10 percent of global supply), which has faced sanctions restricting direct trade with Western nations, and within Canada, where nickel mining remains nascent. Construction of alternative nickel processing capacity requires 5-10 year timelines and represents a capital-intensive undertaking that has attracted limited private investment, given execution risks and geopolitical uncertainty.
Silver presents a distinct constraint dynamic. Silver demand in EV battery management systems, electrical contacts, and charging infrastructure ranges from 25 to 40 grams per vehicle, representing 67-79 percent more silver than in traditional internal combustion engine vehicles.
Samsung’s solid-state battery designs incorporate 1 kilogram of silver per battery pack.
The global silver supply deficit has persisted for five consecutive years, with total demand reaching 1.12 billion ounces in 2024, while mine production and recycling provided only 960-980 million ounces. Silver is primarily produced as a byproduct of copper mining; increasing silver production requires increasing copper mine capacity. However, technological innovation is reducing silver intensity per vehicle at approximately 2-3 percent annually through improved circuit design and material substitution, creating countervailing pressure against rising EV silver demand.
The silver market, unlike lithium and cobalt, exhibits more dispersed geographic production (Australia, Peru, China, Poland, Chile) and less dominance by a single nation, reducing the acute supply concentration characteristic of lithium and cobalt.
China’s control over mineral processing represents the most strategically significant dimension of supply chains. Despite producing only a minority of raw ores, China’s dominance in midstream processing—converting raw materials into battery-grade chemicals and cathode/anode materials—gives it leverage over downstream EV manufacturing globally.
China controls 100 percent of refined natural graphite production, 85 percent of cathode/anode materials production, and 70 percent of cobalt and manganese processing.
This processing dominance emerged through deliberate policy: Chinese governments subsidized midstream manufacturing, invested in ports and transportation infrastructure adjacent to production facilities, and created regulatory frameworks favoring domestic consolidation. Western nations are attempting to establish redundant processing capacity through the Inflation Reduction Act in the United States and various EU initiatives. Still, execution timelines extend beyond the 2030 EV acceleration deadline.
The United States has minimal capacity to process imported cobalt and nickel, with only 3 percent of refined lithium produced domestically. European processing capacity remains concentrated in a limited number of facilities; BASF’s planned battery precursor plant in Finland, scheduled for completion in 2024, remained non-operational as of late 2025.
Technological Innovation and Battery Chemistry Evolution
The structural constraints of lithium and cobalt supply have catalyzed technological innovation in battery chemistry architecture designed to either eliminate resource constraints or reduce per-unit material requirements.
Lithium iron phosphate battery technology has emerged as the dominant growth segment, capturing market share from nickel-manganese-cobalt batteries at accelerating rates. LFP batteries eliminate cobalt entirely, containing only iron, phosphate, and lithium. China has achieved extraordinary cost reductions in LFP manufacturing, driving battery costs down to 53 USD per kilowatt-hour in certain manufacturing facilities by late 2024. This cost advantage has driven global LFP market penetration from 30 percent in 2023 to approximately 50 percent by 2025. LFP chemistry trades energy density for cost and safety; LFP batteries are less energy-dense than nickel-based alternatives, making them suitable for urban vehicles and short-range applications rather than premium, long-range vehicles. However, vehicle manufacturers have responded by expanding battery pack sizes, maintaining range performance at lower energy density through higher total capacity. Tesla’s decision in 2024 to standardize on LFP chemistry for specific vehicle models validated LFP technology's maturation and signaled market acceptance of the cost-performance trade-off.
Sodium-ion battery chemistry represents the emerging alternative to lithium-based systems. Sodium is significantly more abundant than lithium, with global reserves in rock salt deposits and brine aquifers measured in hundreds of millions of tonnes. CATL, the world’s largest EV battery manufacturer, has invested in sodium-ion production, with cells achieving an energy density of 175 watt-hours per kilogram and targeting 200 watt-hours per kilogram by 2027. Sodium-ion advocates project cost parity with LFP batteries within 3-5 years, with advantages including reduced thermal runaway risk, superior performance in cold climates, and slower degradation rates. However, sodium-ion batteries cannot achieve the energy density of premium lithium-based systems, limiting them to applications where range performance is less critical.
Battery chemistry selection has become a strategic decision variable for automakers, with BYD developing full product ranges across LFP and sodium-ion chemistries to address different market segments. This technology bifurcation enables manufacturers to allocate scarce lithium supplies to premium vehicles while servicing mass-market segments with alternative chemistries, partially mitigating but not eliminating lithium constraints.
Recycling technologies are advancing as demand for the recovery of expensive lithium, cobalt, and nickel from end-of-life battery packs accelerates. Economic analysis indicates potential recovery of 75 percent of lithium and 90 percent of nickel and cobalt from spent batteries through advanced pyrometallurgical and hydrometallurgical processes. As EV battery packs from early-adoption cohorts reach end-of-life around 2030, recycling economics will shift from marginal to potentially profitable, creating secondary supply sources that could offset 10-15 percent of primary mining demand. However, recycling cannot address the near-term deficits projected for 2025-2030. Establishing recycling infrastructure at a commercial scale requires 2-3 year timelines and capital investment in processing facilities. Additionally, many current recycling processes remain energy-intensive or generate hazardous waste streams. University of Wisconsin researchers have demonstrated electrochemical lithium recovery from LFP batteries at lower cost and with reduced energy requirements, though commercial deployment remains years away.
Battery cost-reduction trajectories continue on an exponential path. Goldman Sachs projected battery costs would fall to 99 USD per kilowatt-hour by 2025; actual market pricing achieved this threshold ahead of schedule. Current projections estimate 64-80 USD per kilowatt-hour by 2030, with more aggressive forecasts suggesting 32-54 USD per kilowatt-hour for cell-level costs. These cost reductions are being driven by manufacturing scale, decreases in raw material costs (partially reflecting oversupply in certain minerals), chemistry optimization, and manufacturing process innovation, including larger cylindrical cell formats and integrated pack architectures.
Cost parity between EV and internal combustion engine vehicles is projected by 2026-2027 on a total-cost-of-ownership basis, including fuel and maintenance expense, eliminating subsidy dependency for cost-conscious consumers.
This transition to subsidy-independent adoption will shift competitive dynamics toward manufacturers with the lowest manufacturing costs and most efficient supply chains, advantages currently held by Chinese manufacturers.
Geopolitical and Trade Policy Dimensions
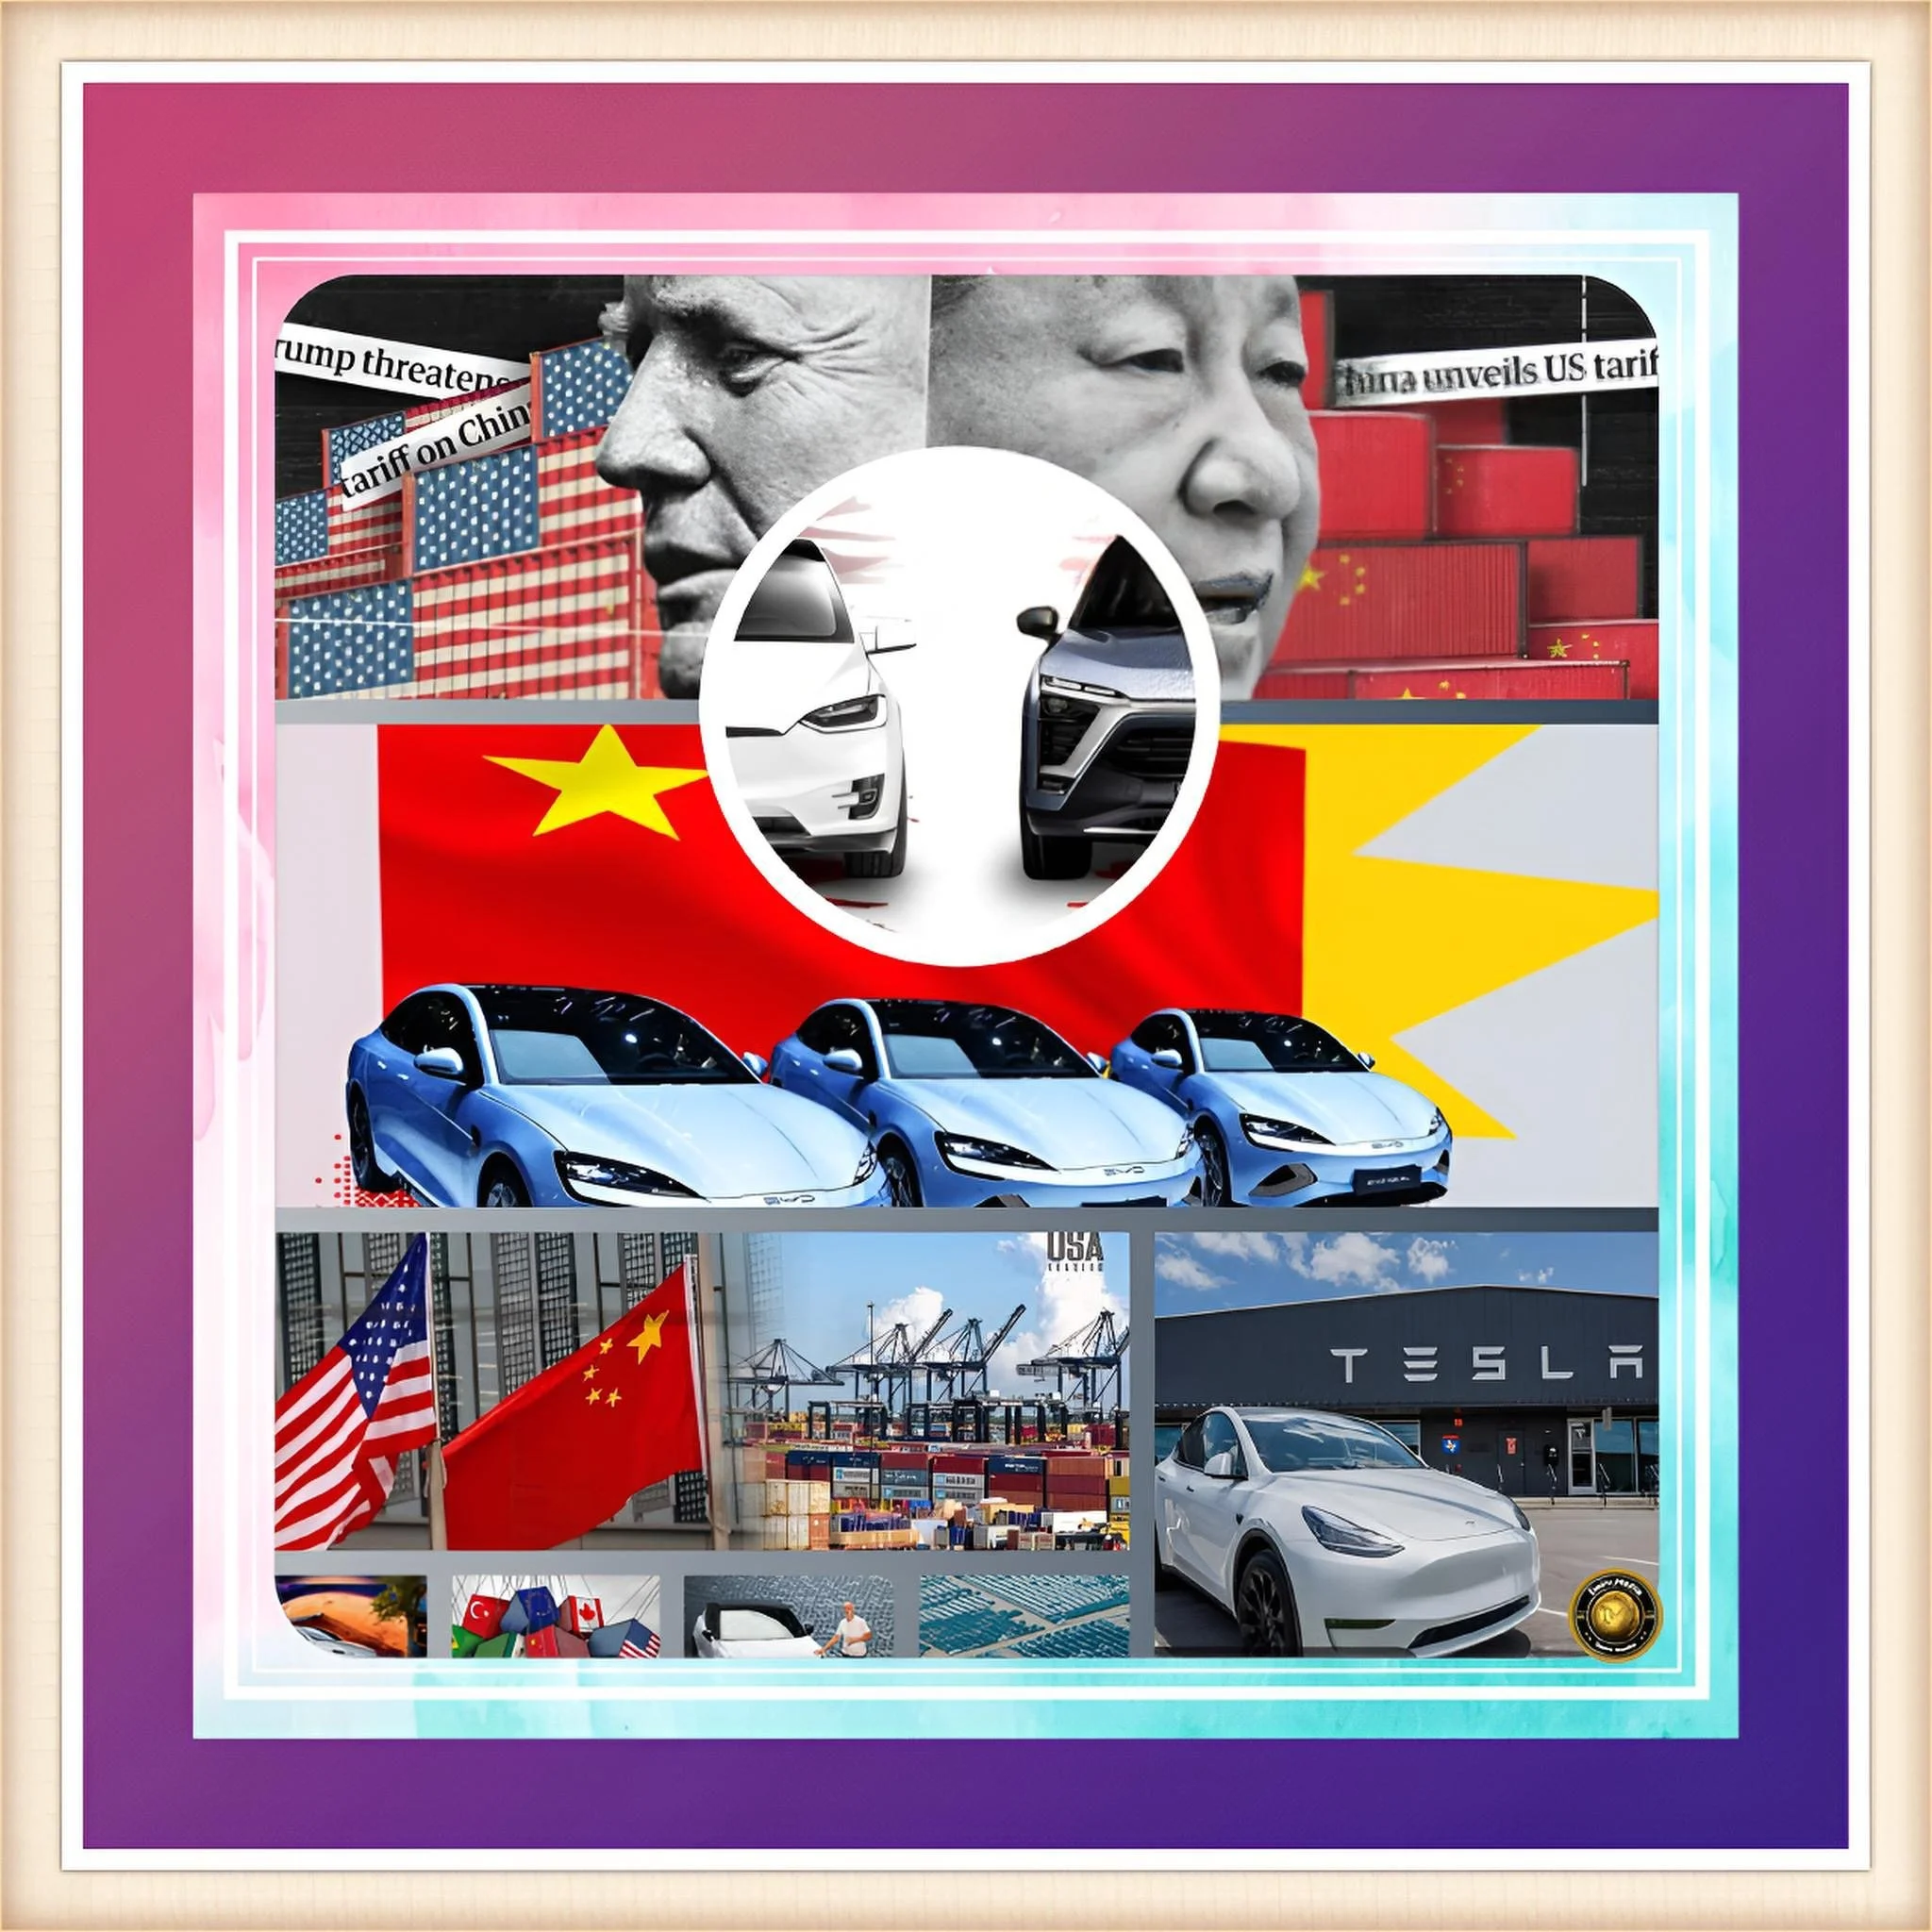
The EV transition has emerged as a primary domain of great power competition between the United States and China. American policymakers have interpreted China’s dominance in EV markets and supply chains as both an economic threat (potentially commanding trillions of dollars in automotive industry value) and a national security vulnerability (dependence on Chinese minerals and battery technology in an increasingly electrified defense ecosystem).
The Trump administration’s 2024 tariff escalation exemplifies this reorientation, with tariffs on Chinese EV imports rising from 25 percent to 100 percent, effective August 2024—a de facto prohibition on Chinese EV imports. Concurrently, tariffs on lithium-ion EV batteries increased from 7.5 percent to 25 percent; additional tariffs on natural graphite, cobalt, and nickel were scheduled to take effect in January 2026.
These tariffs were justified as responses to unfair Chinese trade practices and to protect domestic manufacturing investments. However, they create perverse incentives for Chinese manufacturers to establish manufacturing operations in countries outside the tariff regime while simultaneously increasing EV costs for American consumers, potentially dampening adoption rates.
The European Union pursued a different regulatory approach, initiating anti-subsidy investigations into Chinese EV manufacturers in late 2023.
The EU Commission concluded in 2024 that Chinese EV manufacturers received unfair government subsidies and imposed provisional tariffs of 17.4-38.1 percent on Chinese vehicles, effective October 2024. These tariffs are scheduled to transition to definitive rates in late 2025.
Simultaneously, the EU advanced the “Fit for 55” package, mandating a 55 percent reduction in greenhouse gas emissions by 2030, accelerating the prohibition of internal combustion engines to 2035, and introducing the Carbon Border Adjustment Mechanism beginning in 2026. CBAM places implicit carbon prices on imported goods based on embedded production emissions, with rates phased in from 2026 to 2035. CBAM creates incentives for non-EU producers to locate manufacturing within the EU to avoid embedded carbon charges, potentially attracting both Chinese and other foreign manufacturers to establish plants in EU member states.
The strategic response of Chinese EV manufacturers has been to accelerate manufacturing localization within restricted markets.
Tesla’s Shanghai manufacturing facility, established in 2020, has demonstrated the viability of manufacturing-in-market strategies. BYD established European manufacturing operations beginning in 2024, with production facilities in Hungary targeting European sales. Xpeng and Geely subsidiaries have announced similar localization strategies, positioning themselves to circumvent tariff barriers while establishing beachheads in Western markets. This manufacturing arbitrage strategy reflects the understanding that tariff protection is inherently temporary and insufficient to sustain the protection of domestic markets against superior manufacturing cost competitiveness.
The critical question becomes whether Western manufacturers can leverage the tariff protection window to achieve manufacturing cost competitiveness with Chinese competitors—a proposition that most industry analysts consider infeasible given fundamental labor cost differentials and manufacturing scale advantages already accumulated by Chinese producers.
The Inflation Reduction Act’s provision requiring domestic content thresholds for battery materials represents the most ambitious. By 2024, vehicles must contain at least 50 percent battery content from North American sources, increasing to 100 percent by 2027. This provision immediately created supply constraints, as domestic sources of battery material proved insufficient.
CATL’s decision to cancel planned North American battery plants in response to IRA localization requirements underscores the constraints manufacturers face in meeting content thresholds. Supply gaps have widened since implementation, forcing tariff exclusions on critical battery components and raising EV prices for American consumers.
The long-term viability of North American supply chain localization remains questionable, absent either the discovery of significant new lithium and cobalt deposits (which geological surveys indicate are unlikely in North America) or massive capital investment in processing capacity that economic analysis suggests would remain uncompetitive with globally integrated supply chains.
Russia’s nickel and aluminum supplies represent another geopolitical dimension.
Nornickel, the world’s largest nickel producer, has been subjected to export restrictions through unilateral and coordinated Western sanctions. The United States and the United Kingdom banned imports of Russian aluminum, copper, and nickel in April 2024. These bans have constrained Western access to Russian nickel supplies while pushing Russian production toward Chinese buyers.
Nornickel maintains a refinery in Harjavalta, Finland, which operates as a member of Finland’s battery sector consortium, creating potential pathways for Russian nickel to enter Western EV supply chains through Finnish processing. The geopolitical ambiguity surrounding Russian mineral supplies has elevated uncertainty premium on Russian sourcing while simultaneously increasing Chinese leverage over the handful of alternative suppliers. Putin has explicitly threatened nickel, titanium, and uranium export restrictions in retaliation for Western sanctions, underscoring the weaponization of critical mineral supplies.
Future Outlook Through 2040: Scenarios and Implications
Projections for the global EV market through 2040 exhibit wide variance, depending on policy assumptions and expectations for technological breakthroughs.
BloombergNEF’s base case Economic Transition Scenario, incorporating current techno-economic trends and existing policies, projects EV sales reaching 50 percent of global passenger vehicle sales by 2030 and 70 percent by 2040. In absolute terms, this translates to approximately 30 million EV sales by 2027, 50+ million by 2035, and nearly 72 percent of the 722 million vehicle fleet on roads being electric by 2040.
These projections imply continued Chinese market dominance with possible market share peaks around 65-70 percent of global EV sales through 2030, followed by moderation as Western manufacturers ramp production and achieve manufacturing cost parity. The IEA’s Stated Policies Scenario projects 245 million EVs in global stock by 2030, reaching 525 million by 2035.
Battery demand is projected to reach 4.7 terawatt-hours by 2030, sufficient to sustain mineral supply constraints as binding if alternative chemistries and recycling do not get enough scale.
A contrasting “hyper-adoption” scenario projects EV penetration reaching 47 percent of global sales by 2030 and 86 percent by 2040, driven by aggressive government policies and rapid technological advancements that eliminate cost-parity barriers.
This scenario requires sustained government subsidies, accelerated deployment of charging infrastructure, and technological breakthroughs in battery chemistry and autonomous vehicle integration, creating value propositions that extend beyond cost parity.
Current policy trajectories do not support hyper-adoption scenarios; instead, policy uncertainty and subsidy reductions in major markets (United States, Germany, UK) suggest moderation of adoption rates below BloombergNEF's base-case projections.
A third scenario posits supply-constrained outcomes in which mineral supply deficits become binding by 2028-2030, triggering price spikes in lithium, cobalt, and nickel that curtail demand growth and slow adoption trajectories. This scenario becomes increasingly plausible absent significant additions to mining capacity and successful scale-up of recycling.
Technology evolution through 2035 will likely include the commercialization of solid-state batteries, the integration of autonomous vehicles, and the development of vehicle-to-grid infrastructure. Solid-state batteries, which replace liquid electrolytes with solid-state materials, offer theoretical energy density improvements and faster charging rates, though manufacturing scale-up remains years away.
Commercial availability is projected for 2027-2028 at premium price points, with cost parity and scale production reaching the 2030s. Autonomous vehicle technology will likely progress through Levels 3-4, with robo-taxi and autonomous truck applications preceding fully autonomous consumer vehicles. Vehicle-to-grid infrastructure will enable EV batteries to serve as distributed storage for renewable electricity generation, creating additional value streams for EV owners while supporting grid stability. These technological developments could partially attenuate mineral constraints by increasing vehicle utilization through shared autonomous fleets and extending battery longevity through intelligent charging optimization.
Emerging markets pose the most significant uncertainty about future trajectories.
India’s achievement of 30 percent EV penetration by 2030 requires tripling annual growth rates from the current 200 basis points to 380 basis points.
This achievement would require 1) resolution of charging infrastructure deficits through government capital investment exceeding 50 billion USD, 2) manufacturing cost reductions making EVs price-competitive with internal combustion alternatives, 3) consistent subsidy policy across states and central government, and 4) supply chain localization reducing import dependence.
Current policy implementation suggests these requirements will not be met by 2030; more realistic projections indicate 8-12 percent EV penetration by 2030, with acceleration to 20-25 percent by 2035 as manufacturing costs decline and charging infrastructure expands.
Southeast Asian markets present brighter prospects, with Thailand and Indonesia potentially reaching 25-35 percent penetration by 2030 through a combination of government support and Chinese manufacturer expansion. African EV adoption will likely remain below 5 percent through 2030, given per capita income constraints and import duty structures that favor used vehicles, with acceleration post-2030 only if locally manufactured vehicles achieve competitively low pricing.
Supply Chain Resilience and Systemic Risks
The concentration of EV battery manufacturing, mineral processing, and materials sourcing in specific geographic locations creates systemic vulnerability to disruption from geopolitical conflict, sanctions, natural disasters, or pandemic-related supply shocks. China’s 83 percent share of global EV battery cell manufacturing represents an extreme concentration risk, mirroring the semiconductor industry vulnerability exposed by Taiwan Strait tensions.
A disruption of Chinese battery manufacturing capacity would create global supply shocks, devastating EV production across all regions. The battery industry has recognized this vulnerability; major automakers, including Tesla, Volkswagen, and Ford, have established partnerships with multiple battery manufacturers, including CATL, LG Energy, and SK On, to diversify supply sources. However, diversification remains limited, and all alternatives face the challenge of China’s supply chain integration advantages.
Mineral sourcing presents additional resilience challenges. Lithium supply concentration in Chile, Argentina, and Australia creates vulnerability to regional water stress (a critical constraint in the Atacama Desert), government policy shifts, or geopolitical conflicts disrupting trade.
Cobalt’s concentration in the DRC creates vulnerability to political instability and spillover regional conflict, affecting mining operations. Nickel’s emerging concentration in Indonesia creates vulnerability to changes in environmental regulations or investment retrenchment following deforestation-related criticisms.
Processing bottlenecks represent potentially greater resilience risks than raw material extraction. China’s control over 60-70 percent of lithium, cobalt, and nickel refining capacity means supply chain disruption to China would cascade through global EV production. Sanctions on China—though currently geopolitically unlikely—would immediately create processing bottlenecks that would be impossible to overcome through alternative sourcing. Even absent sanctions, Chinese processing dominance creates negotiating leverage, enabling China to restrict mineral exports or raise prices during supply constraints, forcing Western manufacturers into higher-cost positions.
Strategic mineral reserve stockpiling by Western governments could attenuate short-term disruption risks, though the financial cost of reserve capacity is high and requires policy consistency across political transitions.
Geopolitical fragmentation into competing supply chain blocs presents the highest systemic risk. The emergence of a “US/allied bloc” supply chain distinct from a “China-oriented bloc” supply chain would require parallel mining, processing, and manufacturing infrastructure—an inefficient duplication of capacity that would increase costs, extend timelines to capacity availability, and reduce global manufacturing competitiveness against non-EV transportation technologies (hydrogen fuel cells, advanced biofuels).
Evidence of this fragmentation is already visible: US minerals policy explicitly prioritizes sourcing from allied nations (Canada, Australia) and free-trade agreement partners, while Chinese investment increasingly flows toward long-term mineral supply relationships in Russia, Indonesia, and Central Asia.
European supply chain policies reflect a similar logic, though with additional complexity arising from EU member-state divergence over Russia sanctions enforcement. Complete supply chain bifurcation by 2030 appears unlikely, but increasing fragmentation by 2035 raises the probability significantly, with profound cost implications for EV manufacturing globally.
Conclusion
The Paradox of Rapid Growth Within Structural Constraints
The global electric vehicle transition has achieved a trajectory velocity that most skeptics of five years prior considered implausible. Over 20 percent of new vehicle sales in 2024 being electric, with projections of 50+ percent penetration by 2030, represents a genuine transformation of transportation markets.
Chinese manufacturers have demonstrated their capacity for world-class manufacturing and innovation, challenging the assumption of Western technological permanence. Cost reductions in battery chemistry and EV manufacturing continue to accelerate, approaching and achieving price parity with internal combustion vehicles on a total-cost-of-ownership basis. While charging infrastructure deployment is inadequate in many regions, it is expanding at a sufficient pace to maintain adoption momentum in developed markets.
Yet beneath these indicators of rapid adoption lies a fundamental constraint that receives insufficient policy attention: the materials intensity of EV production cannot be satisfied by current or projected mining and processing capacity through the critical 2025-2035 decade. Demand for lithium, cobalt, nickel, and silver for EV batteries cannot be met by announced mining projects and processing facility expansions.
Geographic concentration of supply in countries facing geopolitical tensions, environmental constraints, or governance risks creates bottlenecks that tariffs and subsidies cannot overcome.
Chinese dominance in mineral processing gives Beijing leverage over the energy transition trajectories of all other nations. Alternative battery chemistries and recycling technologies offer genuine potential to attenuate constraints by the 2030s, but cannot resolve near-term deficits. The strategic responses of the United States and European Union—protectionist tariffs, supply chain localization, and mineral reserve development—are understandable but likely insufficient to achieve manufacturing independence from global supply chains before 2035.
The probable outcome is a differentiated adoption trajectory wherein developed markets achieve high EV penetration (70-80 percent by 2035) through premium pricing and manufactured scarcity, while emerging markets lag at 15-25 percent penetration due to mineral cost inflation and manufacturing capacity constraints.
China will sustain its dominant market position through superior cost competitiveness and supply chain integration, though it faces increasing complexity as Western localization efforts reduce the addressable market. The energy transition will proceed, but at cost and timeline profiles materially different from current policy targets.
Decision-makers across governments and corporations should recognize that the next five years represent the critical window for mineral supply chain decisions—mine permitting timelines, processing facility investment, and recycling infrastructure deployment by 2026 will largely determine the achievable global EV penetration by 2035.
The transition that appeared inevitable in 2024 will be fundamentally reshaped by the material constraints that define the period 2025-2035.