Executive summary
Broken Economic Dashboards: When Classic Recession Indicators Stop Making Sense
Global growth has repeatedly beaten gloomy forecasts since the pandemic. Yet, many of the world’s standard warning lights—consumer confidence, the yield curve, unemployment rules, and survey‑based indicators—have either flashed too early or failed to flash at all.
Major institutions such as the IMF, World Bank, OECD, and UN describe a world economy that is still expanding at roughly 3% a year, even as inflation falls, even as citizens and some advanced economies feel close to stagnation.
This disconnect has led to the claim that “the global economy’s warning signals are broken.” Still, closer inspection shows that the signals are mis‑calibrated to a new regime shaped by pandemic aftershocks, policy experiments, distributional shifts, and data politics.
Introduction
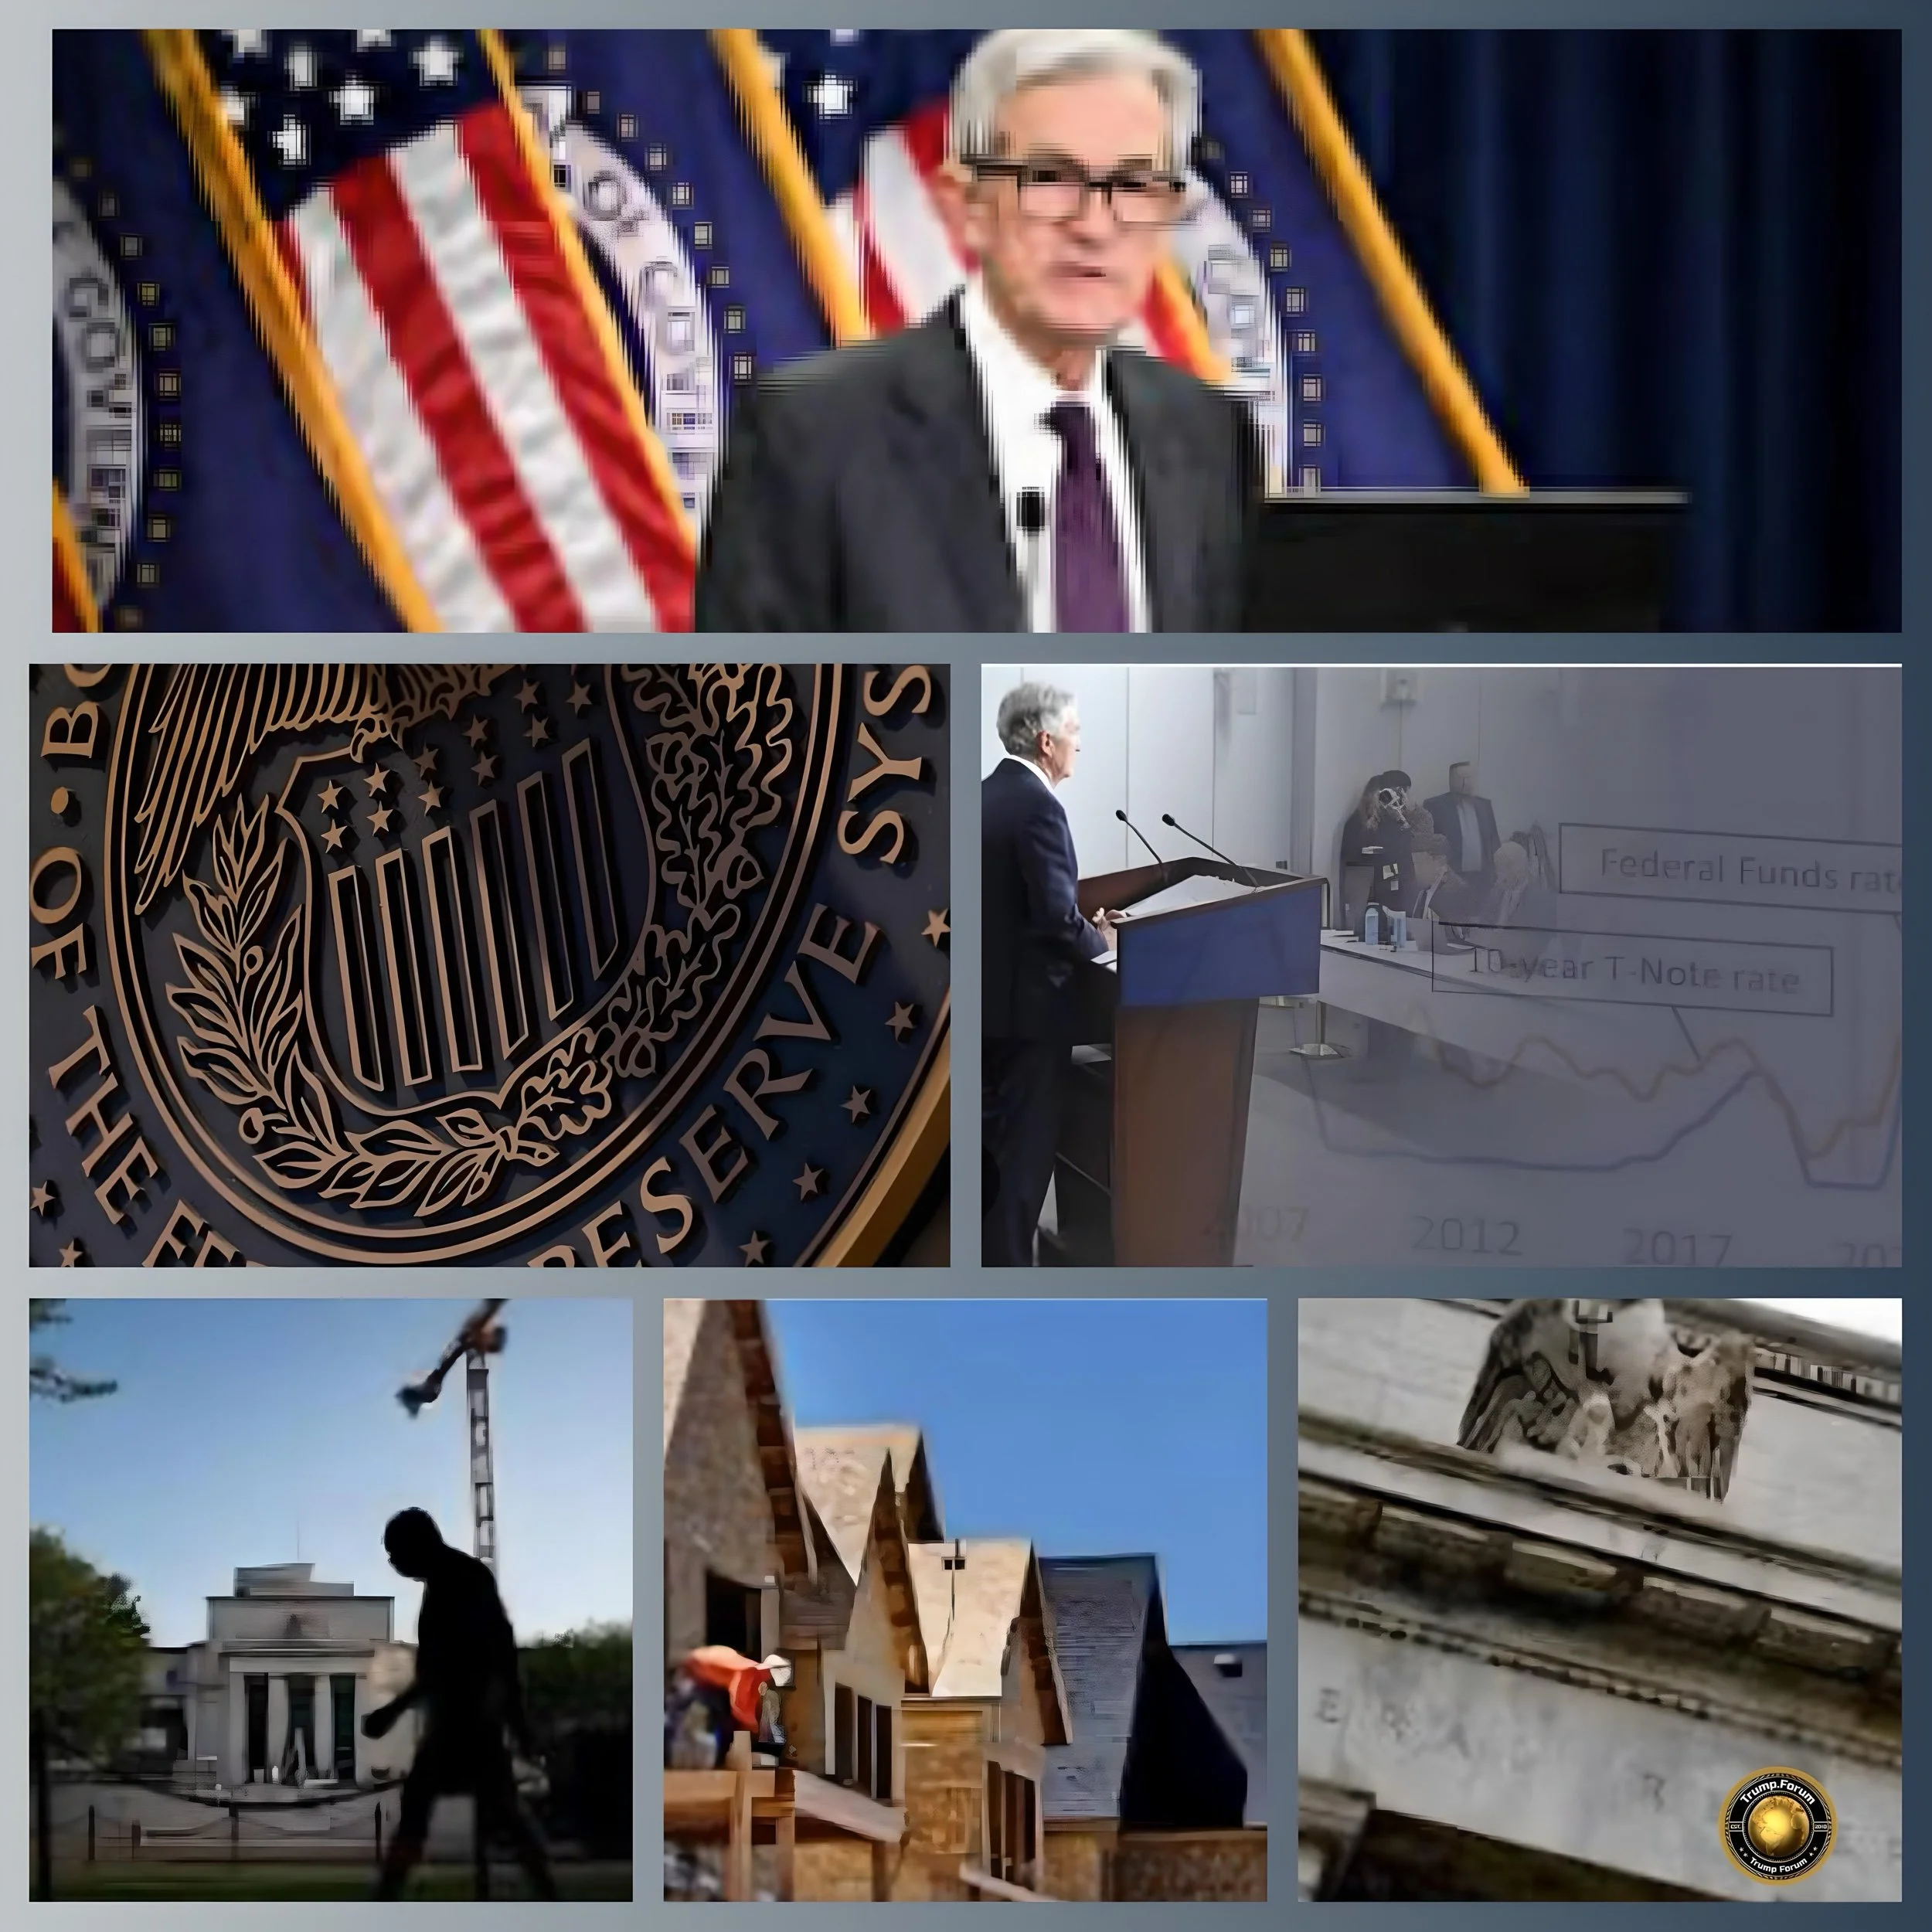
From Yield Curves To Confidence Crashes, The Global Dashboard Malfunctions
A paradoxical cycle
The present cycle is characterized by a striking paradox: macro indicators show resilience, yet micro perceptions signal strain. The IMF’s 2024 and 2025 projections put global growth near 3.1–3.2%, with global inflation moving down from the high single digits toward mid‑single‑digit rates, indicating a slow but absolute normalization.
El País notes that risk maps for this decade are dominated not by classic business‑cycle swings but by geopolitical tension, central‑bank moves, and climate shocks, all of which complicate readings of data.
At the same time, the New York Times reports on “broken” warning signals, highlighting deep pessimism among consumers and analysts, confronting data that refuses to behave as they expect.
History and current status of traditional indicators
For most of the post‑war era, forecasting rested on a small core of reliable relationships. Consumer‑confidence measures, compiled through regular surveys, tended to lead household spending: when confidence collapsed, consumers soon cut discretionary outlays, and recessions often followed.
The unemployment rate, and more recently the Sahm Rule, served as concise gauges of cyclical turning points: a sustained 0.5‑point rise in the 3‑month average jobless rate from its low almost always coincided with an NBER‑dated US downturn.
Perhaps the most celebrated indicator was the yield curve—the spread between long‑ and short‑term interest rates.
The Financial Times and central‑bank research long emphasized that every US recession since the 1960s was preceded by an inversion of the curve, in which short‑term rates rose above long‑term yields, reflecting expectations of future policy easing and credit stress.
In Europe, similar relationships linked the slope of the curve and bank‑lending conditions to subsequent output.
These tools did not offer perfect precision, but they supported a coherent narrative in which deteriorating sentiment, rising unemployment, an inverted curve, and tightening credit formed a sequence.
In the 2020s, each part of that toolkit has been thrown into doubt. US consumer sentiment fell to a 12‑year low while real consumer spending continued to rise.
The Sahm Rule has at times flickered without a formally declared recession, as joblessness edged up only slightly in the United States and other advanced economies.
The US yield curve inverted in mid‑2022 and stayed inverted for an unusually long period, yet by late 2024, GDP growth remained positive, and a broad global recession had not materialized.
Equity markets, especially in technology and AI, have soared even as bond markets warned of future pain.
Key developments since the pandemic
Three shocks stand out in reshaping indicator behavior.
The first is the pandemic itself. IMF staff concede that their inflation forecasts for 2021–22 were wrong by factors of 2.5–5 relative to the pre‑pandemic era; they underestimated the combined effects of massive fiscal transfers, forced savings, and supply-chain bottlenecks.
When inflation surged, many models extrapolated from past episodes driven by overheating demand, assuming that only aggressive rate hikes and substantial unemployment could restore price stability. Yet the actual disinflation from 2023 onward has been driven heavily by the easing of supply disruptions and energy prices, allowing core inflation to fall without massive job losses.
The second shock is the massive policy intervention that accompanied COVID‑19 and its aftermath. Years of quantitative easing compressed term premia and distorted the yield curve well before rates were raised. Households and firms in advanced economies are locked into low-rate, fixed-term debt; banks built large liquidity buffers and adjusted their funding models under post‑crisis regulation.
As JPMorgan and CNBC analyses note, the usual channel from an inverted curve to a recession—through squeezed bank margins and credit retrenchment—has been partially blocked, because many borrowers’ effective funding costs moved only slowly.
The third development is the divergence within and between economies. Saudi Arabia offers a stark example: Arab News and IMF Article IV reports show non‑oil real GDP growing at 4–5%, with low inflation, record-low Saudi unemployment, and repeated upside surprises versus IMF forecasts, driven by Vision 2030 projects, tourism, and investment.
Meanwhile, Germany is “stuck in crisis,” with the Ifo Institute and DW describing stagnation or recession, high energy costs, weak industrial orders, and company bankruptcies at decade‑high levels.
Global averages blend these stories into a bland 3%, but local warning signals reflect very different underlying structures.
Latest facts and mounting concerns
The IMF’s most recent World Economic Outlook and El País coverage of IMF upgrades describe a global economy still on course for around 3% growth in 2024–25, with global inflation expected to ease toward 4–4.5% and advanced‑economy inflation toward 2–2.5%.
The OECD argues that the world is “turning the corner” as inflation declines and trade gradually recovers. overs, though it warns that growth remains below pre‑pandemic norms.
UN WESP analysis similarly notes that 2023 growth exceeded earlier projections, but forecasts a slowdown and stresses that tight financial conditions and climate shocks could derail fragile progress, particularly in low‑income states.
At the same time, FAF risk‑mapping exercises underline a dense cluster of geopolitical and policy threats: prolonged war in Ukraine, escalation in Gaza and the Red Sea, renewed tariff wars, and potential financial‑market stress from high public‑debt loads and tighter US policy.
Foreign Policy’s work on “data theater” adds a further concern: when governments manipulate statistics on inflation, employment, or debt, the resulting distortions feed into IMF, OECD, and market models, undermining the very forecasts that shape expectations.
Within the United States, repeated BLS revisions and political attacks on statistical agencies, combined with selective data releases during government funding stand‑offs, raise questions about the timeliness and perceived neutrality of key indicators.
Cause‑and‑effect
Why warning signals misfire
Several structural shifts have decoupled indicators from the outcomes they once predicted. At the micro level, consumption is increasingly driven by the top of the income distribution.
Moody’s Analytics estimates that roughly half of US consumer spending now comes from higher‑income households, whose financial cushions and asset gains buffer them from shocks.
As the New York Times reports, this means aggregate spending can remain robust even when lower‑income households cut back, substitute cheaper goods, and rely more heavily on credit.
The causal chain from “gloomy sentiment” to “falling consumption” is broken because the marginal dollar of spending belongs to a household that remains relatively secure.
In the labor market, Cleveland Fed research shows that vacancy-to-unemployment ratios and inflation surged to unprecedented levels, then normalized without the spike in unemployment that the traditional Phillips curve would predict.
The cause lies in pandemic‑era mismatches and sectoral rotations that drove prices up, followed by normalization of logistics and energy rather than deliberate mass layoffs.
As a result, the Sahm Rule and related simple triggers have fired amid modest cooling rather than a sharp recession, making them seem unreliable.
On the financial side, years of central‑bank balance‑sheet expansion and regulatory change altered the meaning of the yield curve. As Financial Times explainers and LinkedIn commentary note, term premia have been compressed by central‑bank asset purchases, while banks adjust their hedging and lending strategies to operate with flatter curves.
The causal link from inversion to recession—bank margin compression to credit contraction to demand collapse—has been weakened by stronger capital positions, alternative funding sources, and the prevalence of fixed‑rate debt. The curve still signals expectations about future rates, but its historical relationship with output is attenuated.
Geopolitics further complicates cause‑and‑effect.
The IMF and El País highlight how energy shocks, trade fragmentation, and industrial‑policy races drive regional divergence. In the Gulf, high investment and fiscal space let governments lean against global headwinds, while in Germany, elevated energy prices and weaker Chinese demand amplify them.
A single global warning light cannot capture such varied responses. Foreign Policy’s warning about data theater adds a layer: when inputs are questionable, outputs lose credibility, regardless of model quality.
Future steps
Rebuilding the forecasting dashboard
The answer to “broken” warning signals is not to abandon indicators, but to reconstruct the dashboard. Policymakers and analysts need multi‑layered monitoring that moves beyond headline aggregates.
That means tracking distributions—by income, sector, region, and balance‑sheet strength—so that rising aggregate spending is not mistaken for broad‑based health when narrow groups power it. Labor‑market surveillance must integrate vacancy‑unemployment ratios, hours worked, participation, and job‑switching patterns, rather than relying on a single unemployment rate.
Central banks and finance ministries must also re‑estimate the parameters of their core models to account for post‑2020 realities: altered term premia, changed bank behavior, and the possibility that disinflation can be accompanied by milder employment losses when shocks are supply‑driven.
International bodies should formalize “geopolitical hard‑landing” scenarios, integrating war, sanctions, shipping disruptions, and weaponized trade into baseline risk assessments.
And, perhaps most critically, the independence and capacity of statistical agencies must be protected to counter the rise of data theater and maintain the informational backbone of the global system.
Conclusion
Gloomy Data, Strong Demand: Why the World Economy Confounds Forecasters
Not dead, but out of tune
The global economy’s warning indicators are not dead instruments; they are finely tuned to a world that no longer exists. Rules built on relatively modest shocks, stable institutions, and simple financial plumbing now fail in an era of repeated crises, activist policy, and deep structural divides.
The present cycle, in which gloom coexists with growth and classic alarms sound without a crash, is the product of that mismatch.
For policymakers, investors, and citizens, the task is to treat these misfires as a learning opportunity.
By rebuilding models around distributions, balance sheets, and geopolitics, and by strengthening data integrity, the system can regain a reliable set of early‑warning tools—indispensable in a decade where genuine crises remain all too possible.